Berlin is preparing for local elections in September 2026. Since some of the election districts will change (as is normal with changing demographics), I wanted to make sure that the data in Wikipedia is up to date. All the election districts in Berlin have their own (German) Wikipedia pages (e.g Wahlkreis Friedrichshain-Kreuzberg 5) which all contain a Locator Map at the infobox in the top.
These infoboxes look roughly like this:

I checked Wikimedia commons and noticed that maps for the new election districts had not been uploaded yet.
Since I have been active in the Open Data field for quite some time now, I figured that I could probably generate those maps myself and give something back. I checked Berlin’s Open Data portal and found the election district geometries as well as the bourough (Bezirke) geometries.
I loaded this data up in QGIS and prepared some rules for both labels and symbology.
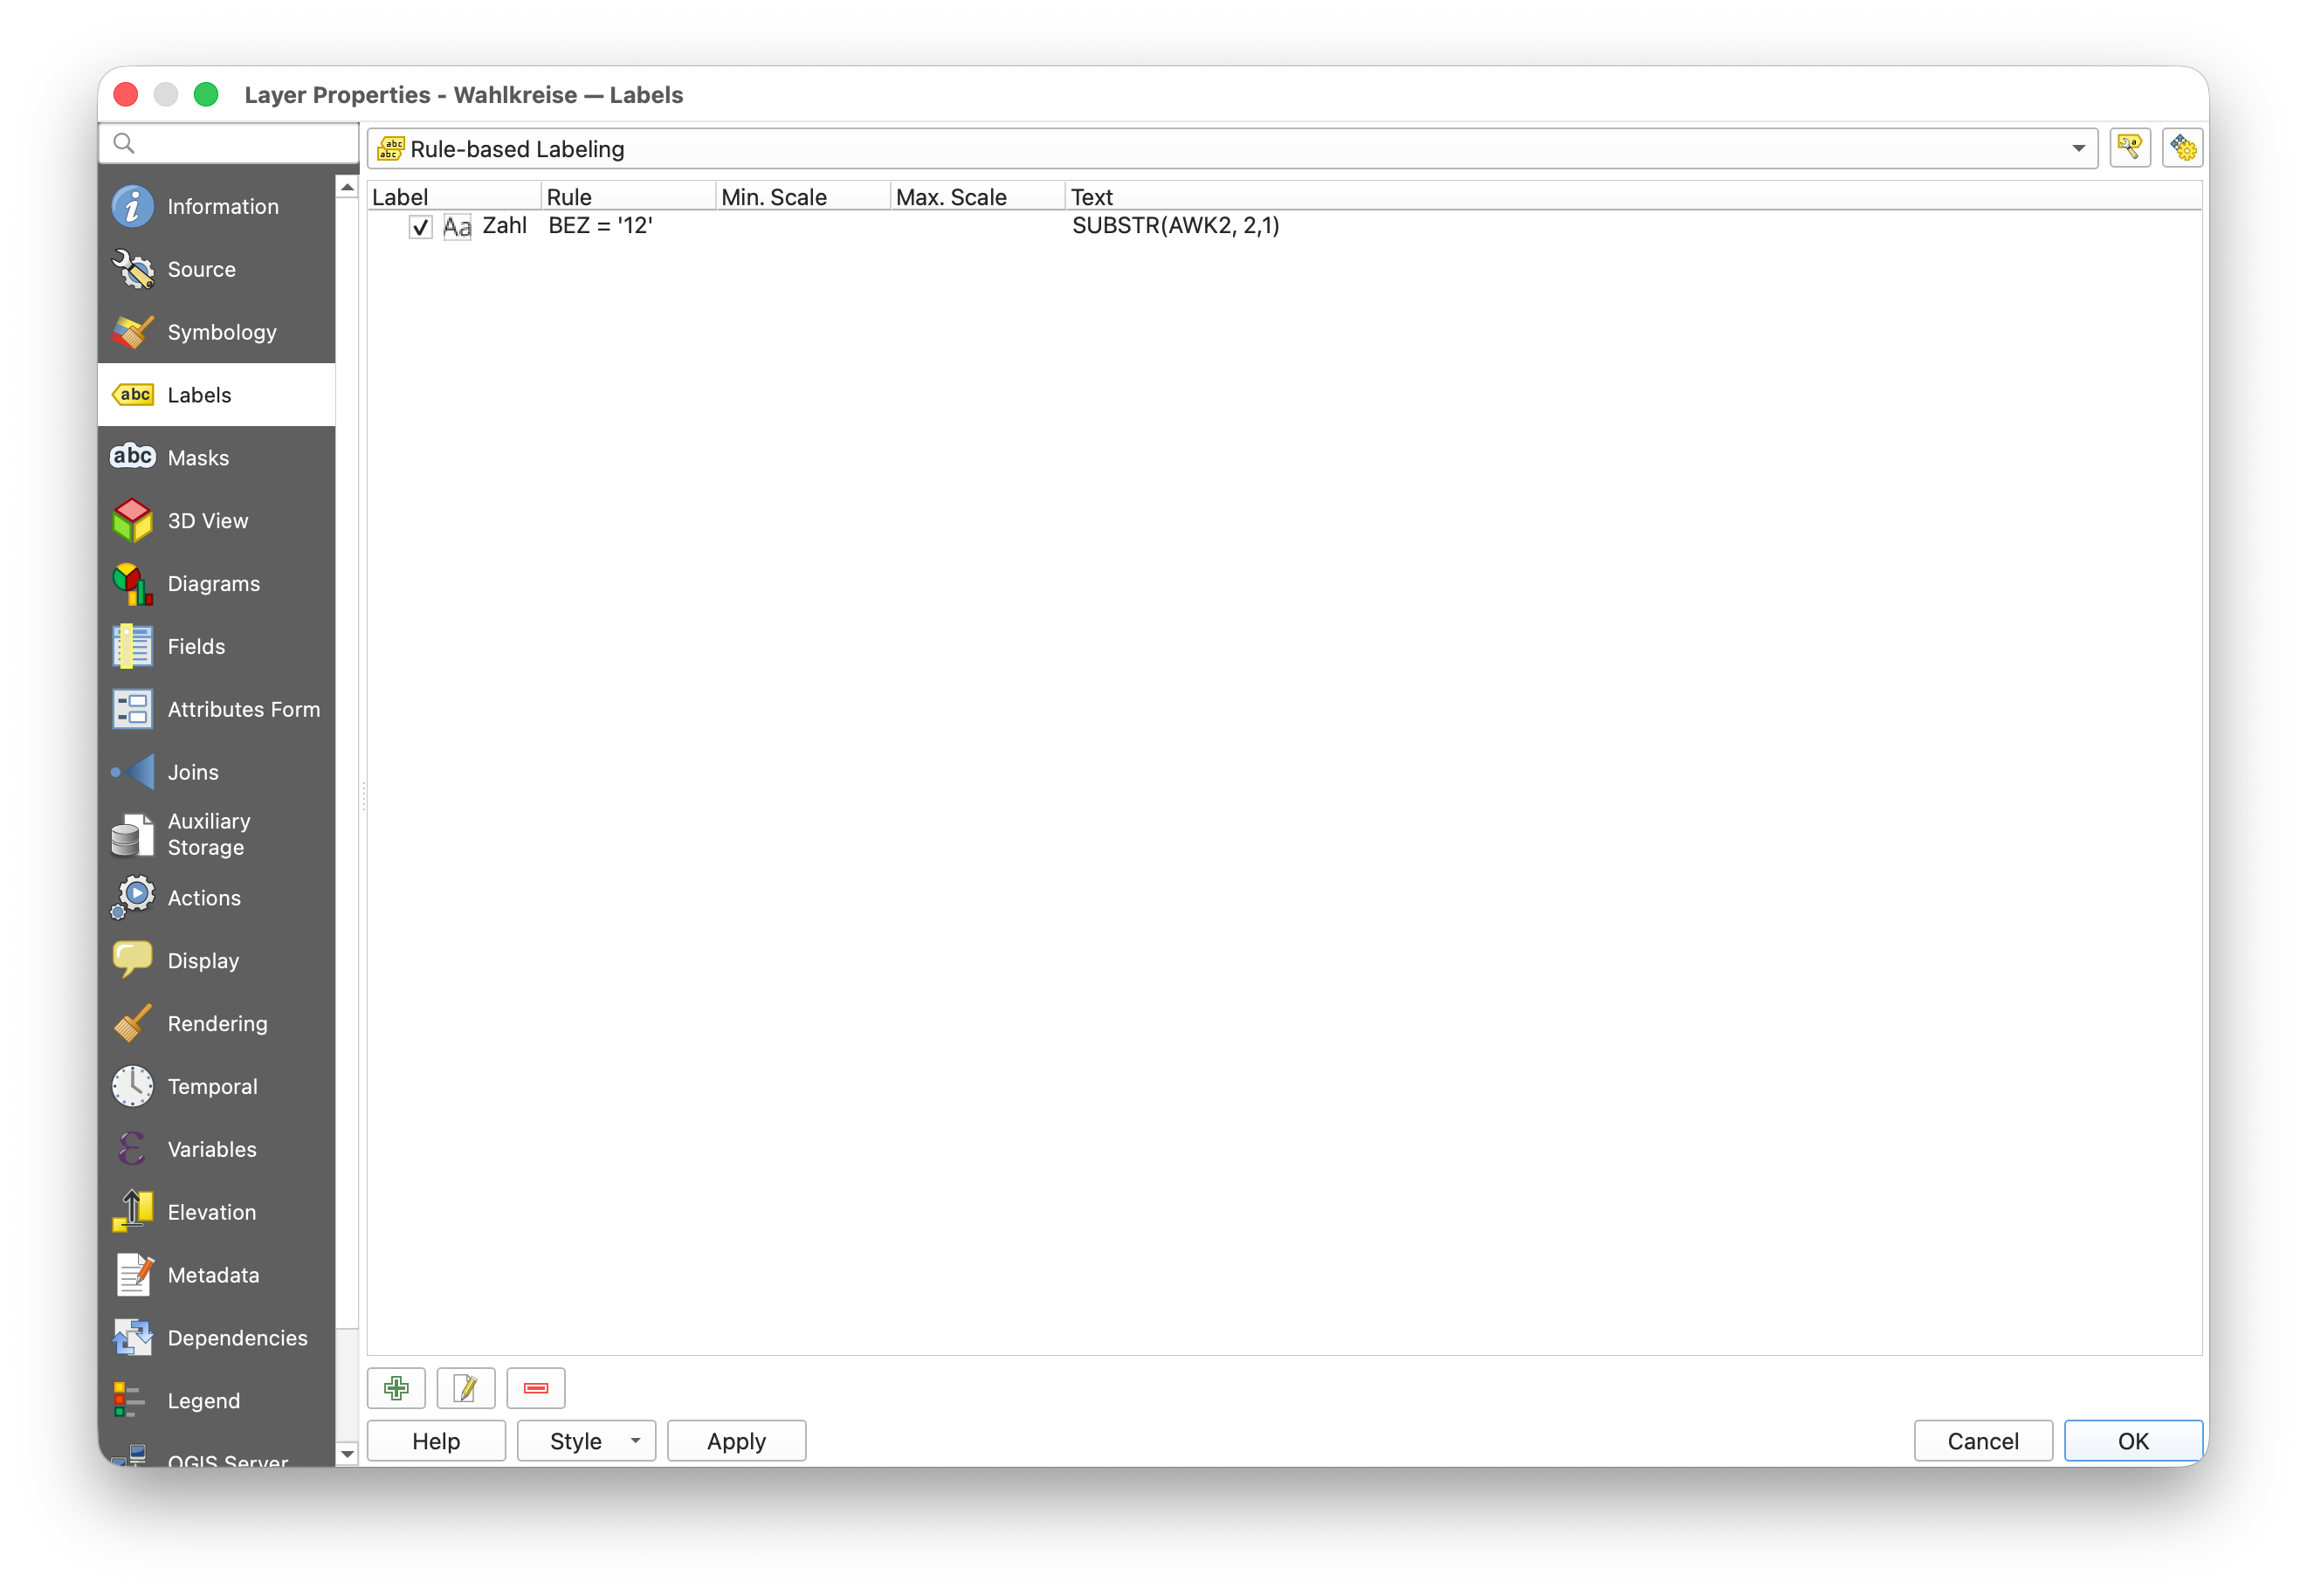
As you can see, there is one rule for the labels. I want to show the numbers of the election districts
in a given borough (in this case 12).
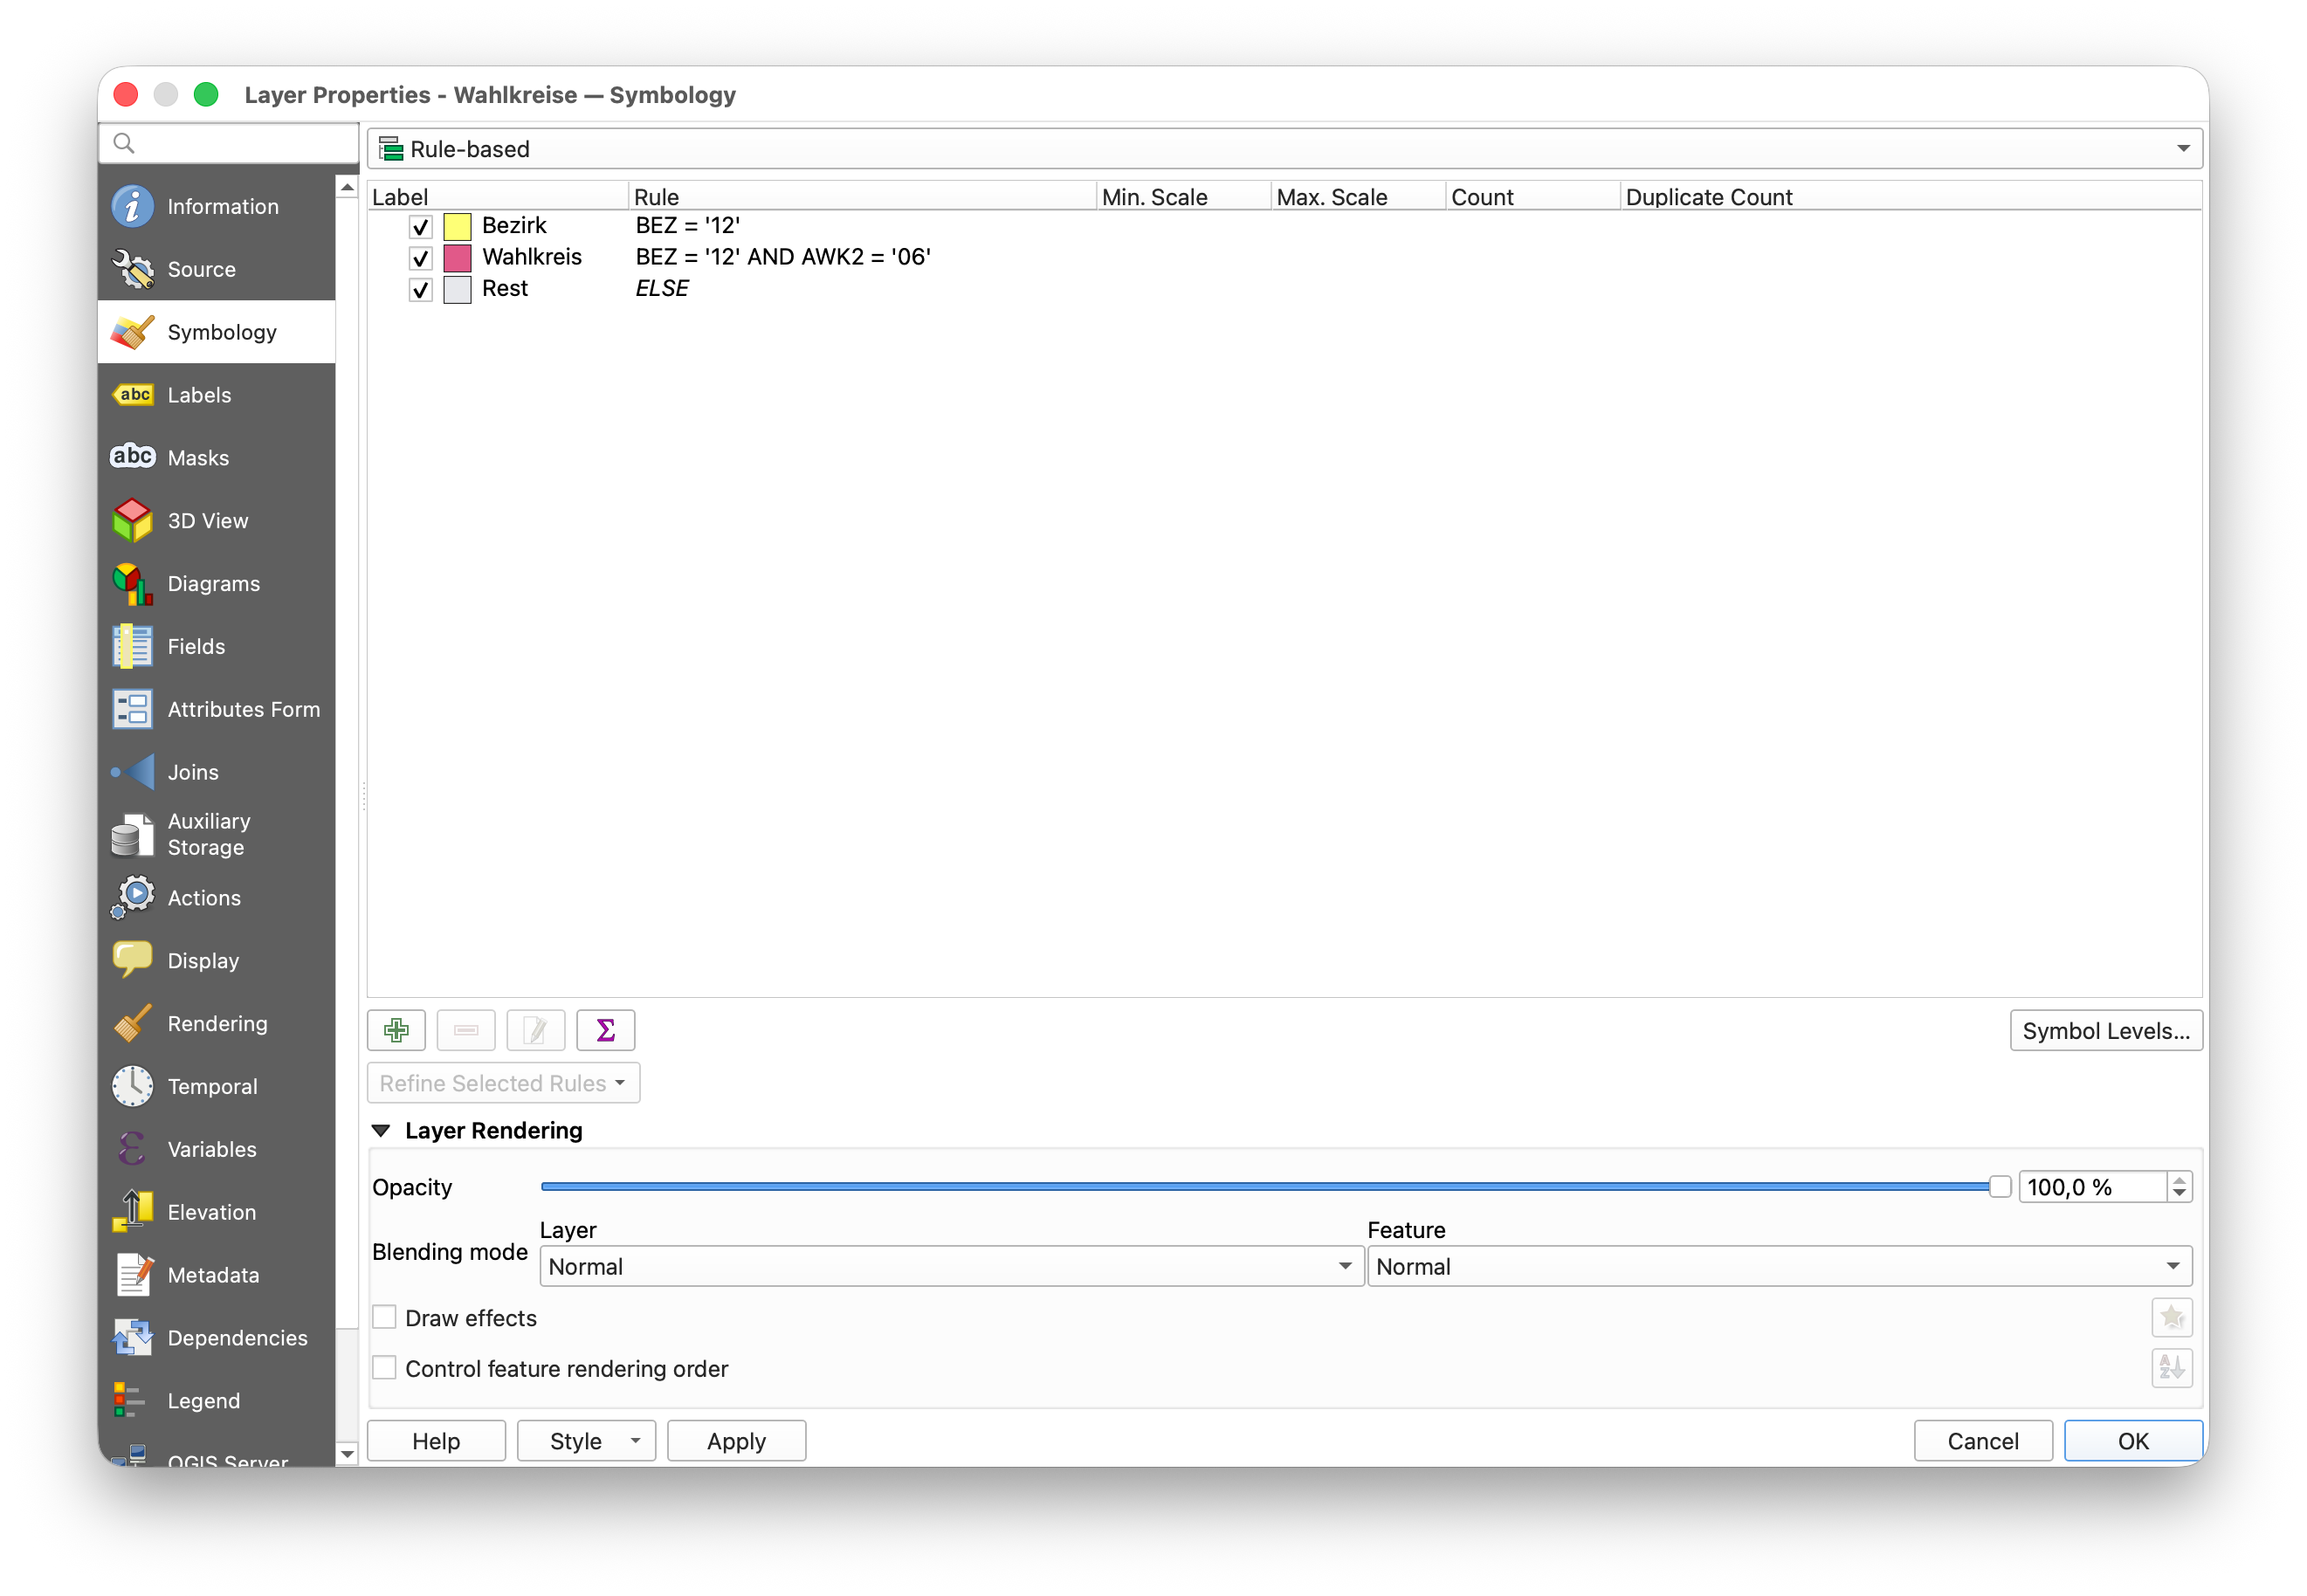 For the layer styles, I am highlighting all election districts in a specific borough and am also
highlighting in a different color, the currently focused election district. All other districts
are shown grayed out.
For the layer styles, I am highlighting all election districts in a specific borough and am also
highlighting in a different color, the currently focused election district. All other districts
are shown grayed out.
There is no specific styling for the borough borders, I just loaded them up and added some basic border styles.
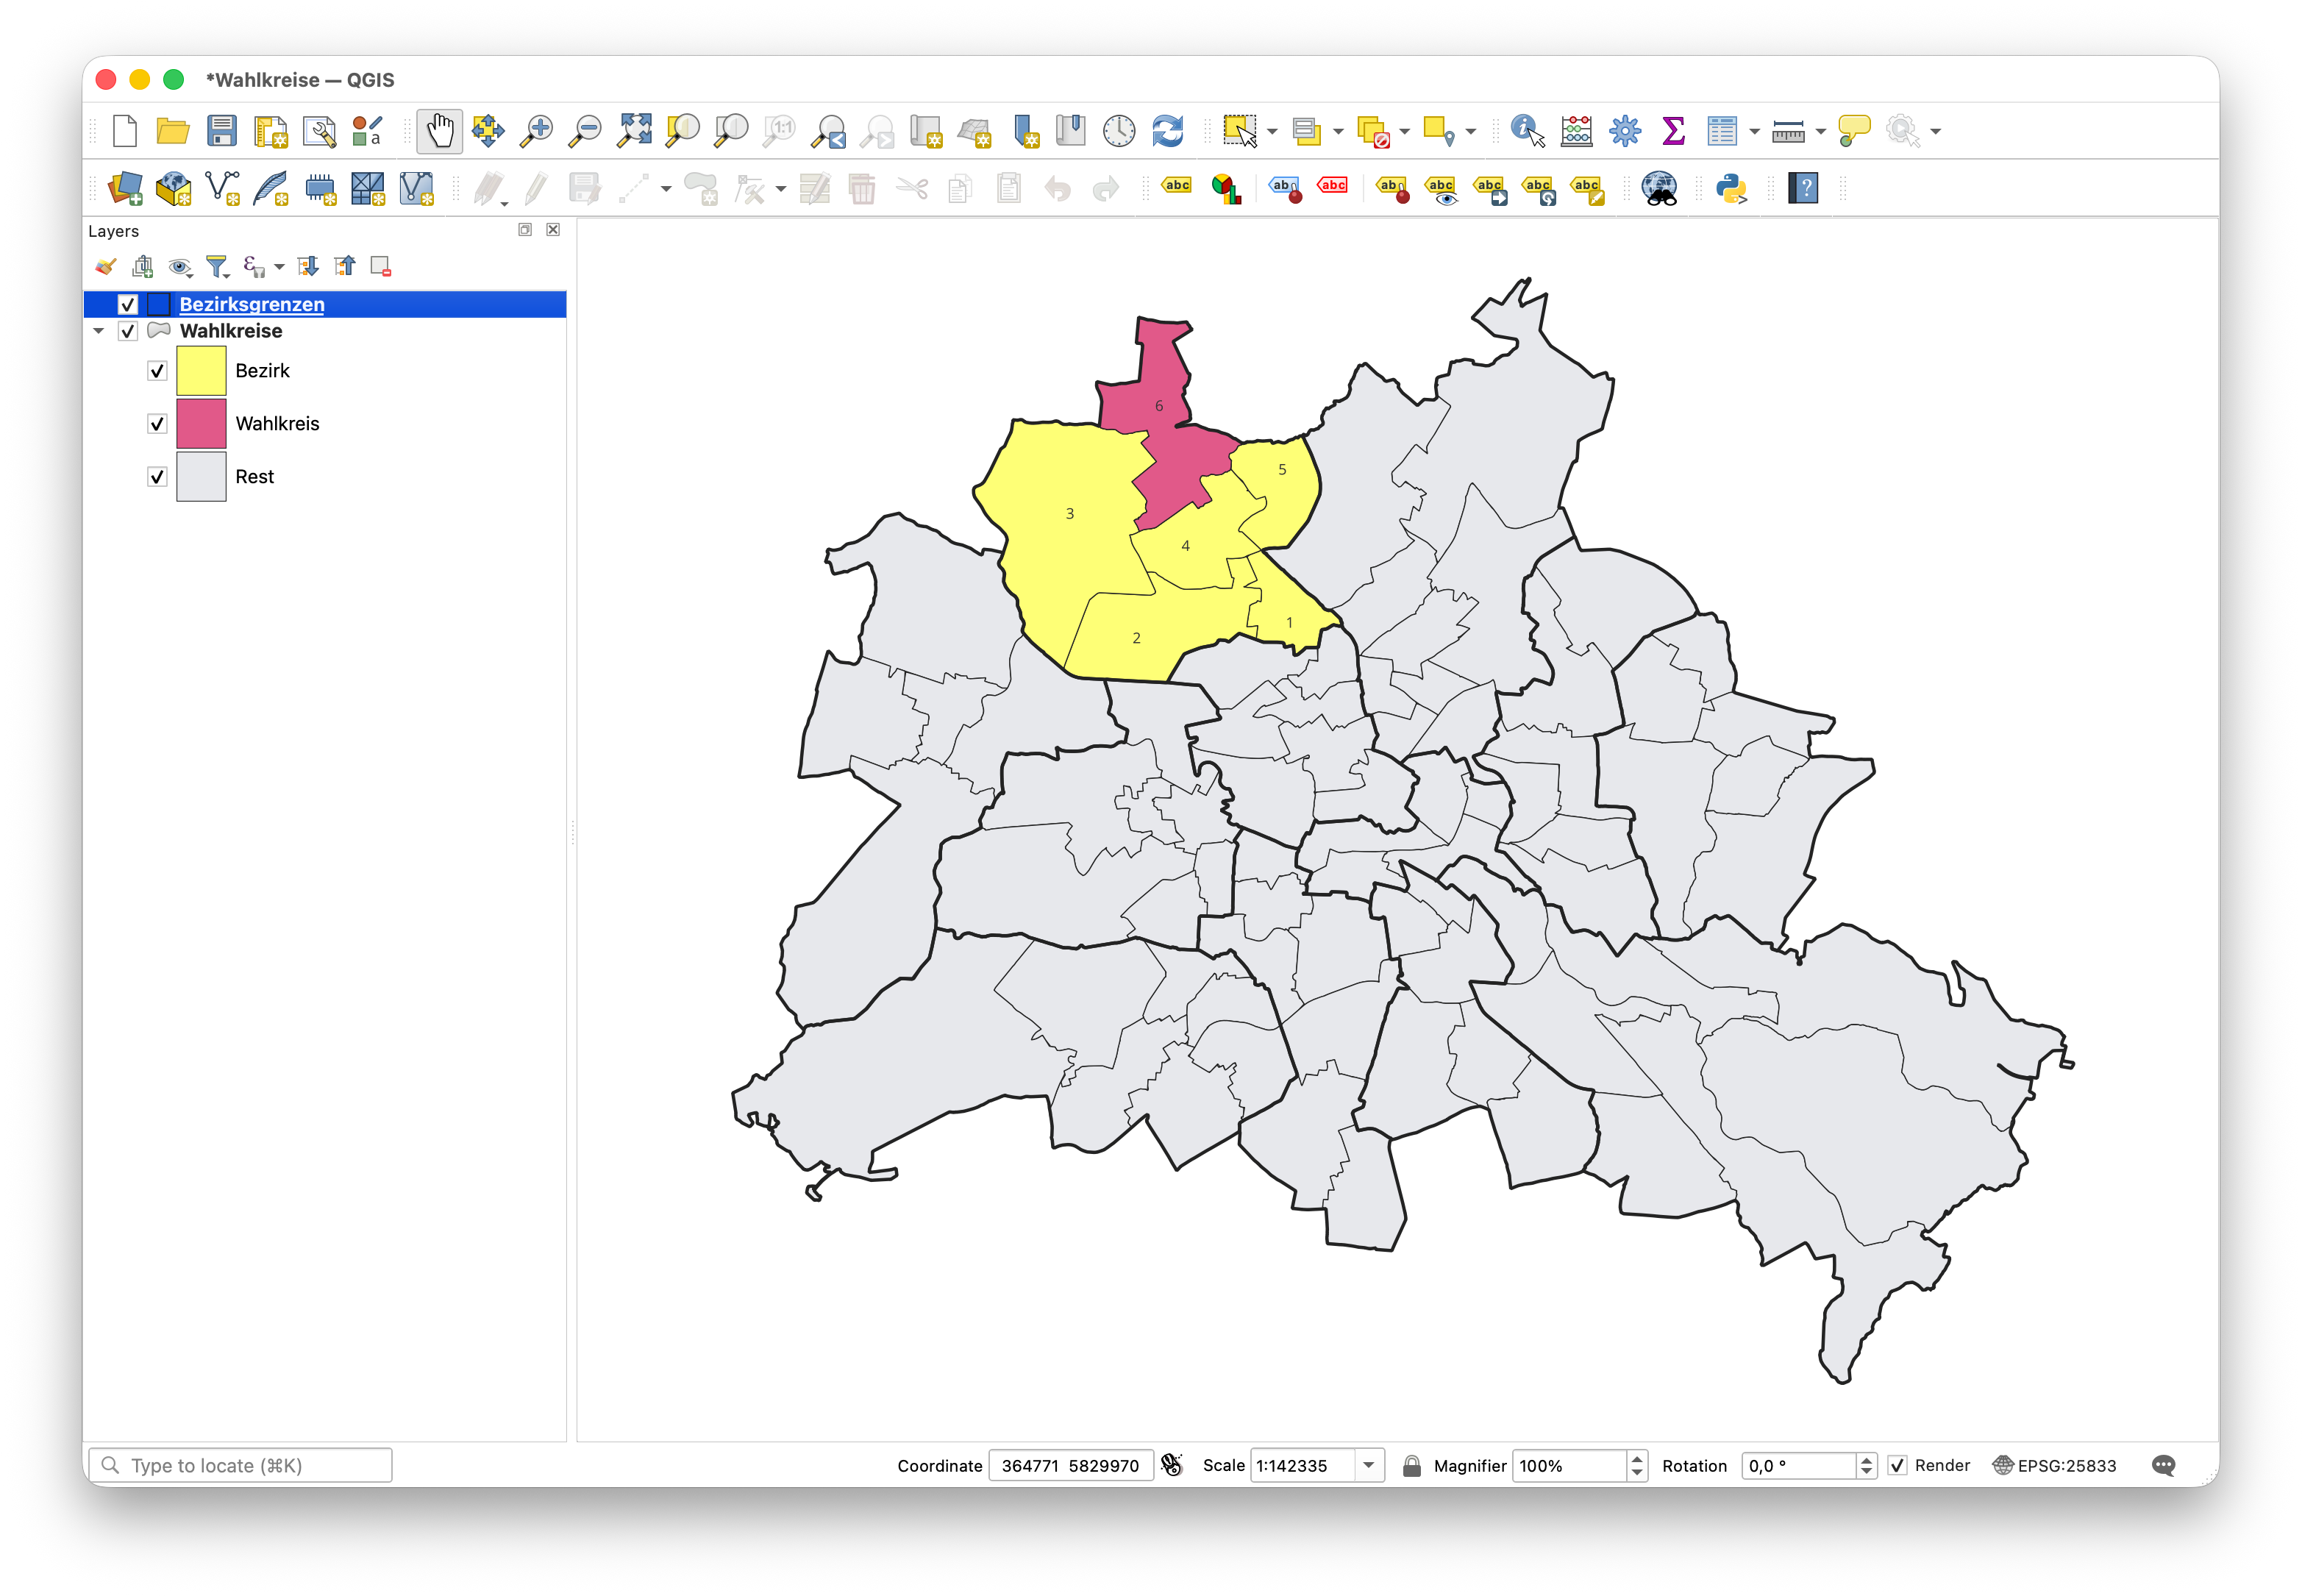
The result looks like this:
I also created a very basic print layout which would just show the map full screen.
There are 78 election districts in Berlin, and I wanted to generate maps for all of them. Since the styles needed to be adapted to each highlighted election district, it would have taken quite a while to manually change the styles and to export the results one by one.
Luckily, QGIS supports Python scripting. I found the documentation a bit difficult to browse, but using a LLM, I was able to find the methods that I wanted to use. That led me to eventually end up with this script that I could use to generate all of my maps:
layer = iface.activeLayer()
renderer_root_rule = layer.renderer().rootRule()
label_root_rule = layer.labeling().rootRule()
layout = QgsProject.instance().layoutManager().layoutByName("Layout 1")
exporter = QgsLayoutExporter(layout)
svg_settings = QgsLayoutExporter.SvgExportSettings()

request = QgsFeatureRequest()
request.setFlags(QgsFeatureRequest.NoGeometry) # Don't load spatial data for speed up
request.setSubsetOfAttributes(['BEZ', 'AWK2'], layer.fields())

combinations = [(feature['BEZ'], feature['AWK2']) for feature in layer.getFeatures(request)]

names = {
    '01': 'Mitte',
    '02': 'Friedrichshain-Kreuzberg',
    '03': 'Pankow',
    '04': 'Charlottenburg-Wilmersdorf',
    '05': 'Spandau',
    '06': 'Steglitz-Zehlendorf',
    '07': 'Tempelhof-Schöneberg',
    '08': 'Neukölln',
    '09': 'Treptow-Köpenick',
    '10': 'Marzahn-Hellersdorf',
    '11': 'Lichtenberg',
    '12': 'Reinickendorf',
}

for bez, awk in combinations:
    bezirk = f'BEZ = \'{bez}\''
    wahlkreis = f"BEZ = '{bez}' AND AWK2 = '{awk}'"
    for rule in renderer_root_rule.children():
        if rule.label() == 'Bezirk':
            rule.setFilterExpression(bezirk)
        if rule.label() == 'Wahlkreis':
            rule.setFilterExpression(wahlkreis)
    for rule in label_root_rule.children():
        if rule.description() == 'Zahl':
            rule.setFilterExpression(bezirk)
    layer.triggerRepaint()
    name = names[bez]
    output_path = os.path.join("/Users/knut/Desktop/bezirke", f"Berlin-AGH-2026-{name}-WK-{awk}.svg")
    result = exporter.exportToSvg(output_path, svg_settings)
    if result == QgsLayoutExporter.Success:
        print(f"Exported {output_path}")
As you can see, I am creating all the combinations of borough (Bezirk) and election district (Abgeordnetenhauswahlkreis - AWK). I then change my filter expressions for the layer styles and labels (the ones you saw in the screenshots) to match the current combination. Finally, I export the maps a SVGs to a folder.
I was able to run this script in the python console of my QGIS project. It worked fairly nicely.
To me, this was a good combination of manual visual iteration in QGIS to get the styles that I liked, combined with some code for the tedious automation. It was fun, and I’m looking forward to using these newfound skills again in the future.
If you are curious, you can find all the generated files on Wikimedia Commons.